At a glance
| Daily Iron Condor | Daily Iron Butterfly | |
|---|---|---|
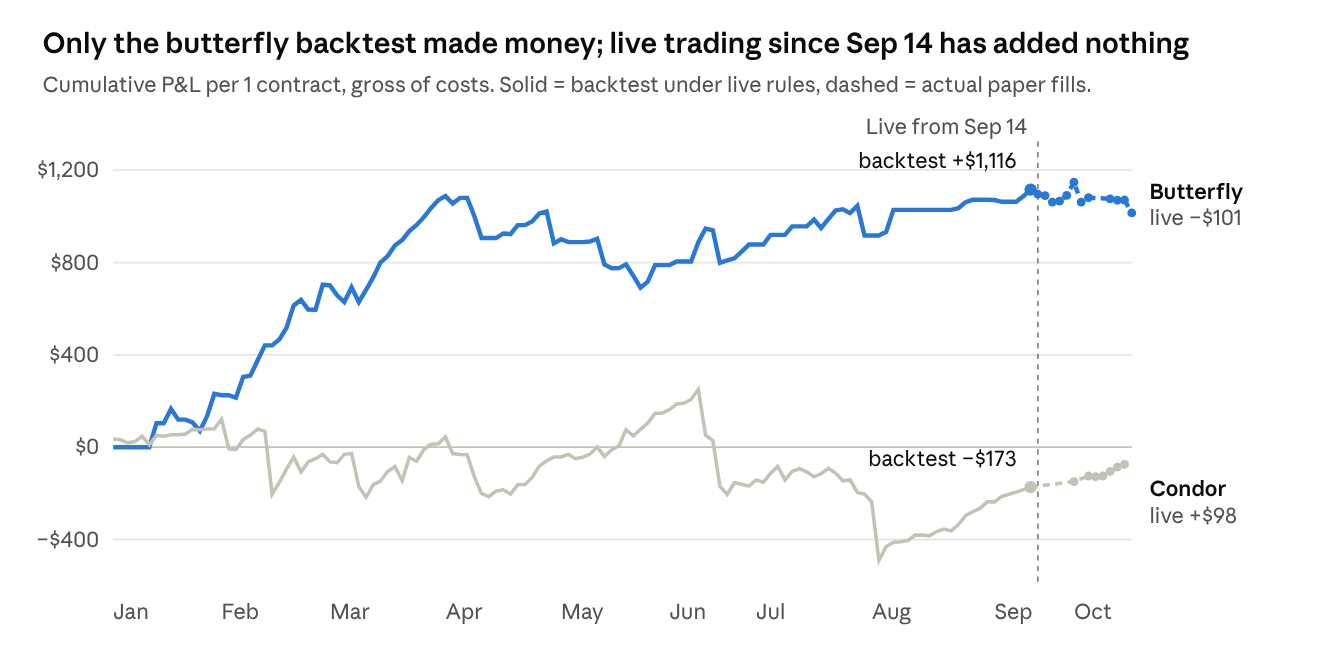
| Backtest, live rules (Jan 5 – Sep 11, gross) | −$173 on 128 trades, profit factor 0.92 | +$1,116 on 88 trades, profit factor 1.91 |
| After ~$5/contract round-trip cost | about −$813 | about +$676 |
| Untuned (every day, no credit floor, gross) | −$173 (the live rules have no floor) | +$251 |
| Independent out-of-sample test, same structure (Apr–Sep) | −$167 at mid; about −$590 after $5/trade | — |
| Live paper trading, 1 contract | +$98 realized on 7 trades; Oct 22 trade still open | −$101 on 12 trades, 5 winners |
| Typical credit vs. max loss per contract | $143 vs. ~$925 | $664 vs. ~$336 |
The condor should be paused or re-gated. Under the rules it trades live, its own backtest loses money before costs, and a separate out-of-sample study of the same structure loses more. It keeps selling credits as small as $34.50 against about $1,165 of risk per contract.
The butterfly has a thin, unproven edge. The backtest profit is about $12.70 per trade before costs. Execution costs about $5 of that on Alpaca's paper simulator, and the credit floors that create most of it were tuned on the same data. Real fills are likely worse: at $0.03 a leg (about $24 a round trip), the backtest turns to roughly −$1,000. Twelve live trades lost $8 each. With a per-trade standard deviation of about $51, that is roughly one standard error below expectation, which is not enough to confirm or reject the edge.
Both strategies also have operational gaps that have cost more than their edge, which we describe below.
How each strategy works
The two strategies are near twins built on the same trading engine. They differ only in where the short strikes sit and in the minimum credit they accept.
| Daily Iron Condor | Daily Iron Butterfly | |
|---|---|---|
| Short strikes | ATM ± 1.5% of SPY, rounded to $1 (e.g. 755 P / 779 C at SPY 767) | ATM straddle (e.g. 767 P / 767 C) |
| Long wings | 1.5% beyond each short, about $12 wide | 1.5% beyond ATM, about $12 wide |
| Expiry | That week's Friday (4 days to expiry on Monday, 1 on Thursday) | Same |
| Entry | 9:40 ET, Monday–Thursday market days | Same |
| Credit floor | Off: anything above $0.01 | $650 / $600 / $550 / $500 at 4 / 3 / 2 / 1 days to expiry |
| If below floor | Re-quotes every minute for 20 minutes, then skips the day | Same |
| Entry order | One 4-leg limit order at the mid credit minus $0.10/share | Same |
| Exit | 4-leg market order at 15:40 ET; no retry | Same, with a 15:45 retry and a 15:50 backstop |
| Profit target / stop | None | None |
What each structure is betting on. The butterfly sells the at-the-money straddle, so it collects about 4½ times the credit. It also loses from the first dollar SPY moves and is short a lot of gamma. The condor's shorts sit 1.5% away, so a normal day leaves both spreads untouched. What it collects is mostly far out-of-the-money time value, which the bid/ask spread consumes. Because both hold weekly options for only six hours, they harvest a small slice of decay. They are really betting that SPY's realized move from 9:40 to 15:40 comes in below what the options priced.
What changed recently. On October 6 the current condor replaced an older SPY condor that had expected-value and risk:reward gates; the current version has neither. On October 16 both strategies began trading every subscribed account.
Backtest under the live rules
Our nightly backtest builder reads each strategy's current credit floor and exit time and re-prices every day in the January 5 – September 11 dataset. We re-ran it against the scripts exactly as they trade today. All figures are per contract, at mid prices, with no costs.
| Condor | Butterfly | |
|---|---|---|
| Days in data / trades taken | 128 / 128 | 128 / 88 |
| Total P&L | −$173 | +$1,116 |
| Average per trade | −$1.35 | +$12.68 |
| Win rate | 63% | 68% |
| Average win / average loss | +$25 / −$47 | +$39 / −$44 |
| Profit factor | 0.92 | 1.91 |
| Max drawdown | $741 | $397 |
| Worst day | −$272 (Feb 12, 1 DTE) | −$141 (Jun 11, 1 DTE) |
| Best day | +$100 | +$109 |
The condor wins often but small, and loses about twice as much when it loses. That's a payoff ratio of 0.53 on a 63% win rate, which nets out slightly negative. The butterfly's wins and losses are about the same size, and its edge comes from winning 68% of the time.
Live paper trading
We trade one contract of each strategy on our own paper accounts, so their fills are a clean per-contract record. The butterfly has traded since September 14; the current condor since October 1.
| Condor | Butterfly | |
|---|---|---|
| Trades closed | 7 | 12 |
| Realized P&L | +$98 | −$101 |
| Winners | 6 of 7 | 5 of 12 |
| Average per trade | +$14 | −$8 |
| Best / worst | +$24 / −$3 | +$57 / −$86 |
| Open at time of writing | Oct 22 condor, credit $34, marked about −$41 before the Oct 23 open | None |
Realized P&L is from Alpaca paper fills, so it is net of the bid/ask spread actually paid.
The condor's live result is better than its backtest. Seven trades in a quiet stretch is about what a 63%-win structure looks like before its first bad day. The butterfly's −$8 per trade is about $20 below the backtest's gross +$12.68. With a per-trade standard deviation of about $51, twelve trades carry a standard error of about $15. The live result is roughly one standard error below what the backtest predicts after costs: not yet evidence for or against the edge.
Other accounts that follow these strategies trade the same orders at larger size and show the same day-by-day pattern, so we don't report them separately.
Capital at risk
Both structures have defined risk: maximum loss is the wing width × 100, less the credit, per contract. Alpaca holds that amount as options buying power while the position is open.
| Per contract | Condor | Butterfly |
|---|---|---|
| Wing width now (SPY ≈ $767) | $12 | $12 |
| Credit, backtest average | $143 | $664 |
| Max loss, backtest average | $925 | $336 |
| Credit as % of max loss | 15% (Oct 22 live: 3%) | about 200% |
| Backtest P&L per trade ÷ max loss | −0.15% | +3.8% |
| Recent live max loss | $1,044 (Oct 19) to $1,166 (Oct 22) | $463 (Oct 19) to $656 (Oct 22) |
The 653% figure. The published backtest page shows an annualized return for the butterfly of about 653%. That is the gross daily average ($8.72) × 252 ÷ the average max loss ($336). It assumes mid fills, no costs and the in-sample credit floors, and it reuses the same $336 of capital every day. After about $5 of round-trip cost per trade, the same arithmetic gives roughly 400%. Without the tuned floors it turns negative (+$251 gross, minus about $640 in costs). It should not be read as an expected return.
What drives the returns, and how far to trust the backtest
1. Most of the butterfly's profit comes from a filter tuned on the same data
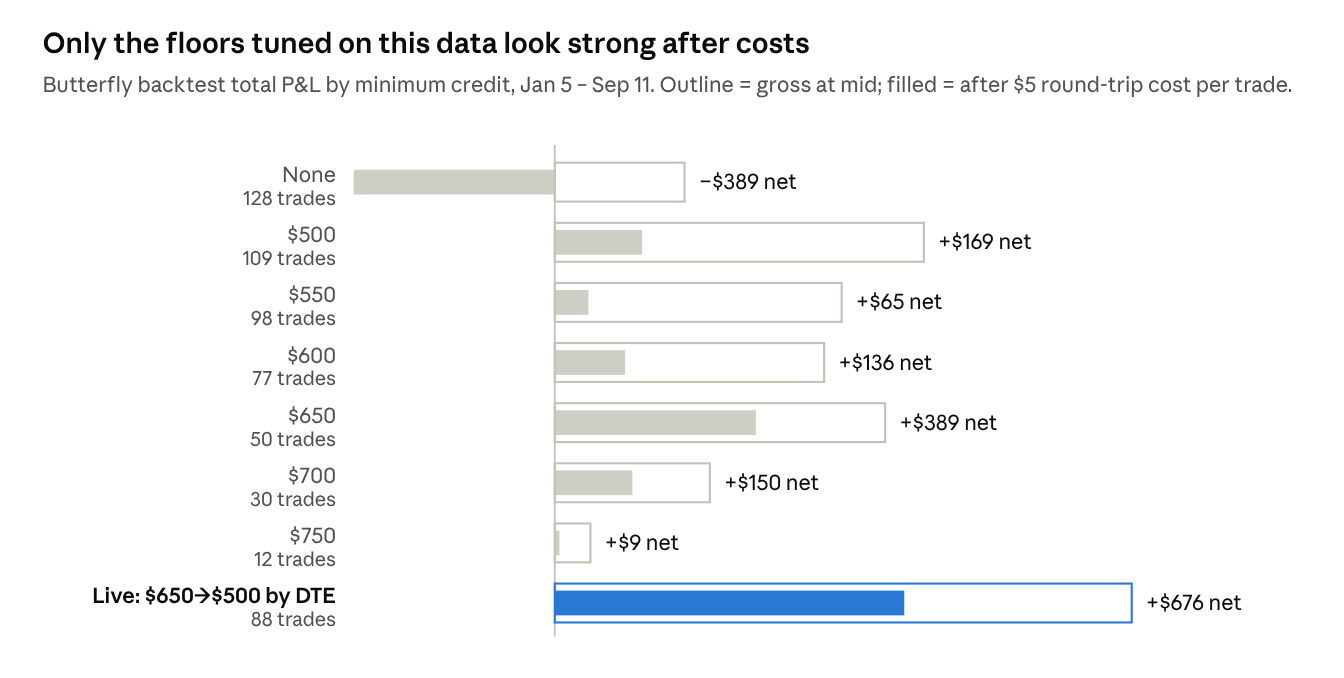
Taking every day, the butterfly made +$251 gross over 128 days, about $2 per trade. The credit floors lift that to +$1,116. They were chosen by sweeping thresholds on this same January–September sample. A real effect would make results improve steadily as the floor rises. Instead they jump around: $500 → +$714, $550 → +$555, $600 → +$521, $650 → +$639, $700 → +$300.
2. The clearest overfit tell is the 1-DTE bucket
On Thursdays the butterfly lost $310 across all 33 days. On the 17 Thursdays that clear the $500 floor, it made +$308. A $500 credit on a one-day option may be a real signal that implied volatility is rich, but a $618 swing on 17 trades from one hand-picked threshold is what curve-fitting looks like.
| Days to expiry | Condor, all days | Butterfly, all days | Butterfly, floor applied |
|---|---|---|---|
| 4 (Mon) | −$119 on 29 | +$68 on 29 | +$133 on 20 |
| 3 (Tue) | −$256 on 33 | −$26 on 33 | +$206 on 25 |
| 2 (Wed) | +$277 on 33 | +$519 on 33 | +$469 on 26 |
| 1 (Thu) | −$75 on 33 | −$310 on 33 | +$308 on 17 |
Gross P&L per contract at mid, January 5 – September 11, 2026, by days to expiry at entry.
Wednesday is the only day that works for both structures without a filter. That could be a real midweek effect or chance on 33 samples.
3. Costs are as large as the edge
Live fills come in about $3 under the logged mid credit at entry. The strategies' own mid-marked P&L runs $4–6 above the fill P&L on the same trades, so a round trip costs about $5 per contract. That takes the butterfly backtest from +$1,116 to about +$676 and the condor from −$173 to about −$813. The backtest assumes mid prices at both ends; a market-order exit at 15:40 never gets mid.
4. An independent out-of-sample test agrees on the condor
A separate study scored fixed condor configurations, chosen on January–March data, against April 1 – September 15. One configuration is essentially the live structure (next-Friday expiry, 1.5% / 1.5%, 15:40 exit, no filter, but a 9:30 entry). It lost $167 at mid, about $590 after a $5 round trip, and $2,183 at that study's $0.03 a leg (about $24 a round trip). A version with a take-profit, stop and implied-volatility band roughly broke even at $5 (about +$40) and lost $965 at $0.03 a leg.
The same study found that a 0DTE condor with tighter shorts, held to settlement, made money out of sample: +$385 to +$917 after $0.03-a-leg slippage on 22–29 trades. That is the more promising direction for a condor.
5. Regime
The butterfly made most of its backtest money in January–March (+$1,070). From April to September it was close to flat (+$46), and April–May was negative. Short-gamma strategies do well in calm, mean-reverting tapes and give it back when trends start. The worst live day shows the mechanism. On October 5 the butterfly lost $86 when SPY opened at $769.84 and climbed steadily to close near its high at $774.97, about 0.7% away from a short straddle centred at the open. October 22 (−$56) was the same pattern in the other direction.
Prior evidence. An earlier butterfly configuration logged 364 entries. Its entry-time expected-value estimate had a median of +$300, while the realized mean outcome was −14.9%. The strategies' expected-value figure is not a reliable guide for butterflies.
Operational issues
- Thursday condor exits fail. With one day to expiry, the far long wing often has no quote, so the broker rejects the 4-leg market order. The condor has no retry, so on every Thursday it has traded (October 1, 8 and 22) the position was carried into expiry. At the time of writing, the October 22 condors were open with the short put about 5 points from the money.
- No credit or risk gate on the condor. Any credit above $0.01 is accepted. On October 22 it sold a $34.50 credit for $1,166 of risk, paying the bid/ask on a near-zero credit while carrying the full tail risk.
- No stop or profit target. Both strategies hold until 15:40 whatever happens. The real worst case is the full wing, $1,166 per condor or about $656 per butterfly. The backtest's worst day (−$272) understates it: the 128 days in the sample had no crash.
- Market-data outage. A data-feed error on October 14–15 caused both strategies to skip those days.
- Sizing isn't capped to buying power. Order size isn't checked against an account's options buying power, and a rejected order doesn't raise an alert.
- Backtest pages can drift from live rules. The published backtest pages are built from a separate copy of the scripts. The credit floors and exit time match today, but nothing guarantees they will stay in step.
- In-sample tuning, gross results. The butterfly's credit floors, and the Sharpe ratio and annualized return on its backtest page, are in-sample and before costs. Live trading is unlikely to match them.
What we plan to change
- The exit. We plan to send the close as a limit order at the combo mid, stepping toward the bid over a few minutes, and to let any long leg bid at $0.00–$0.05 expire rather than sell it. We also plan to add a 15:45 retry and a Friday-morning cleanup for any position still open.
- The condor's entry gate. We plan to pause the condor or require a minimum credit-to-max-loss ratio (for example, at least 10%), along with the expected-value and risk:reward gates the older condor had. If we keep a condor, the out-of-sample work points to 0DTE with 0.5% shorts held to settlement, not this structure.
- The butterfly as a pre-registered test. We plan to freeze its rules, keep one contract, and judge net-of-cost P&L after about 60 trades. At the backtest's 69% pass rate on Monday–Thursday, that is roughly five to six months. We are also considering a single flat $650 floor in place of the tuned schedule by days to expiry.
- Sizing. We plan to cap each account's quantity at what its options buying power supports, and to alert when an order is rejected.
- The backtest pages. We plan to build them from the live scripts, show results after costs ($5 per round trip) alongside an untuned baseline, and drop the annualized-return figure.
Sources and methodology
- Scope. This note covers the Daily Iron Condor and Daily Iron Butterfly strategies as they trade today. It does not cover the earlier multi-ticker daily options family or the weekly iron condor and butterfly strategies.
- Backtest. Our nightly backtest builder, re-run against the live scripts on January 5 – September 11, 2026 option legs, premiums and minute-level market values. Our figures match its last logged output (−$173 on 128 trades and +$1,116 on 88). The floor sweep, days-to-expiry split, monthly split and cost sensitivity are additions for this note.
- Out-of-sample. A separate daily iron condor study, with configurations chosen on January–March data and scored on April 1 – September 15.
- Live. Alpaca paper-trading fills on our 1-contract accounts: the butterfly since September 14, and the condor from October 1 (two earlier trades on that account used an older $5-wing version and are excluded). Positions were last read before the October 23 open, so the October 22 condor mark will move.
- Costs. About $5 per contract round trip, from comparing logged mid credits and the strategies' mid-marked P&L with actual fills on seven recent trades. No commissions are modeled; Alpaca paper trading charges none on options.
Results are from paper-trading accounts and backtests and do not reflect real money. Paper and backtest results may differ materially from live trading. Past performance does not guarantee future results. This note is research and education, not investment advice or a recommendation to trade any strategy or security. Options involve substantial risk and are not suitable for all investors.