At a glance
| Weekly Iron Condor | Weekly Iron Butterfly | |
|---|---|---|
| Backtest, live rules (33 weeks, Jan 5 – Sep 8, gross) | +$1,019 on 16 trades, 81% winners | +$1,053 on 15 trades, 80% winners |
| Same, every week, no floor | +$969 on 33 | +$1,073 on 33 |
| After ~$5/contract round-trip cost | about +$939 | about +$978 |
| Worst week / max drawdown | −$707 / $1,231 | −$258 / $464 |
| Live paper trading, by the rules (1 contract) | +$180 on 1 trade | +$645 on 3 trades, all winners |
| Weeks traded of the last 4 (Sep 28 – Oct 19) | 0 | 2 |
These are in better shape than the daily versions. Both make money across all 33 backtest weeks without any filter, so the edge doesn't depend on a tuned threshold. A four-day hold collects about $30–70 a week net, several times the roughly $5 it costs to trade. The butterfly's live record (+$645 on 3 trades) is consistent with its backtest.
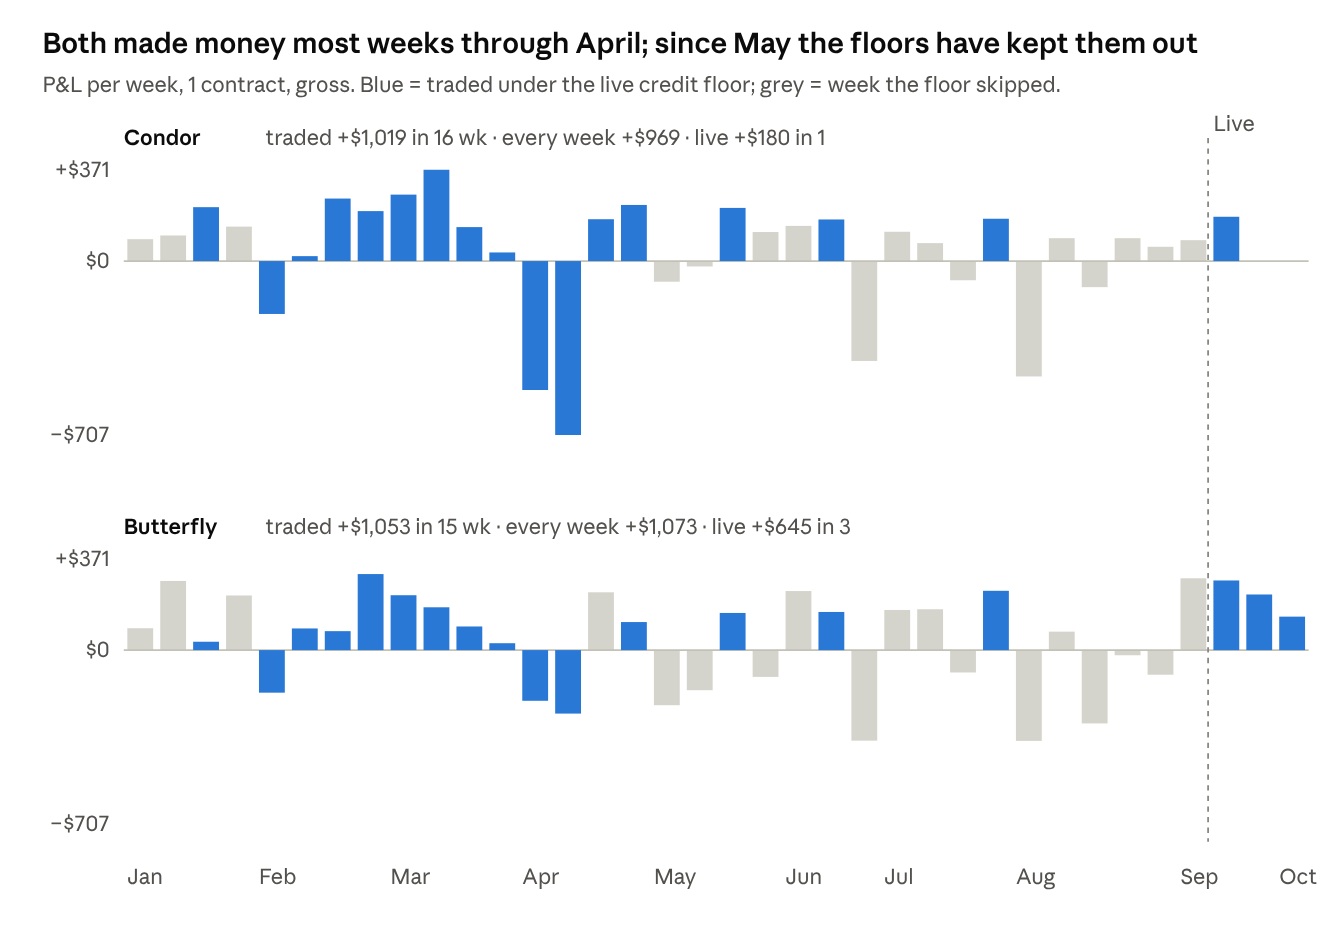
The edge is concentrated in one regime. Unfiltered, the butterfly made +$1,333 from January to April and lost $260 from May to September. The condor's two worst weeks (−$524 and −$707) both came in April. Thirty-three weeks is a small sample, and none of them included a real crash.
The dollar floors have made both strategies mostly dormant. As SPY rose and implied volatility fell, credits dropped below the fixed floors. Only 3 of the 17 backtest weeks from May onward passed for either strategy, and the condor hasn't traded live since September 21. A floor scaled to the wing width would keep the strategies trading without loosening the risk test.
How each strategy works
The two strategies differ only in strike placement and credit floor. They share a trading engine with the daily condor and butterfly.
| Weekly Iron Condor | Weekly Iron Butterfly | |
|---|---|---|
| Short strikes | ATM ± 1.5% of SPY, rounded to $1 (about ±$11–12) | ATM straddle |
| Long wings | 1.5% beyond each short, about $12 wide | 1.5% beyond ATM, about $12 wide |
| Expiry | That week's Friday | Same |
| Entry | Monday 9:40 ET. Tuesday if Monday was a holiday or Monday's attempt failed before deciding (data error, unfilled order); not if Monday's credit was too low. | Same |
| Credit floor | $200 in the strategy code; the live schedule currently passes $150 | $700 |
| If below floor | Re-quotes every minute for 20 minutes, then skips the week | Same |
| Entry order | One 4-leg limit at the mid credit minus $0.10/share | Same |
| Exit | Thursday 15:40 ET 4-leg market order, a 15:45 retry, then a 15:50 backstop that closes the account's positions | Same |
| Profit target / stop | None | None |
| Accounts | Our own paper account, 1 contract | Our own paper account, 1 contract |
What each is betting on. Holding from Monday to Thursday collects about three of the option's four days of time decay, compared with the daily versions' six hours. That gives the weekly structures much more premium to work with relative to the bid/ask spread. The butterfly is short the at-the-money straddle and wins when SPY finishes Thursday near Monday's price. The condor wins as long as SPY stays within about ±1.5% through Thursday. One three-day move of 2% or more costs it most of the wing.
History. Both started live on September 14 and moved to our production trading host on October 5. The September 21 trades in both accounts were entered at 11:08 ET and closed at Wednesday's open, and the condor's credit that day ($76) was under its floor. Those look like manual or test trades, so we count them separately below.
Backtest under the live rules
Our nightly backtest builder re-prices every Monday entry from January 5 to September 8 (33 weeks), with the Thursday 15:40 exit and the strategies' current credit floors. We re-ran it against the scripts exactly as they trade today. Figures are per contract, at mid prices, with no costs.
| Condor, $200 floor | Butterfly, $700 floor | |
|---|---|---|
| Weeks traded | 16 of 33 | 15 of 33 |
| Total P&L | +$1,019 | +$1,053 |
| Average per trade | +$64 | +$70 |
| Win rate | 81% | 80% |
| Average win / average loss | +$190 / −$482 | +$141 / −$212 |
| Profit factor | 1.70 | 2.65 |
| Max drawdown | $1,231 | $464 |
| Worst week | −$707 (Apr 13) | −$258 (Apr 13) |
The condor's profile is the classic short-premium one: frequent wins of about $190, and occasional losses about 2½ times as large. Its two April losses (−$524 and −$707) erased almost seven average wins. The butterfly's losses are smaller because its credit, about $755, covers most of the $1,000–1,200 wing.
Live paper trading
Both strategies trade one contract on our own paper accounts. These results are from fills, so they're net of the spread actually paid.
| Week of | Condor | Butterfly |
|---|---|---|
| Sep 14 | +$180 (credit $201) | +$283 (credit $741) |
| Sep 21 (off-rule: 11:08 entry, Wednesday exit) | +$38 (credit $76, under floor) | +$57 |
| Sep 28 | Skipped (best credit $160) | +$226 |
| Oct 5 | Skipped ($107) | Skipped ($680) |
| Oct 12 | Skipped ($91) | Skipped ($648) |
| Oct 19 | Skipped ($178) | +$136 |
| By the rules | +$180 on 1 trade | +$645 on 3 trades |
Skipped weeks show the best credit offered on Monday. Rule-based totals exclude the September 21 trades.
The butterfly has won every week it traded, averaging +$215 against a backtest average of +$70. With a backtest standard deviation of about $165 per trade, three trades can't separate luck from edge, but nothing here contradicts the backtest. The condor has traded once under the rules. Two of its four skipped weeks ($160 and $178) would have cleared the $150 floor now in use.
Capital at risk
Maximum loss per contract is the wing width × 100, less the credit. Alpaca holds that amount as options buying power from Monday to Thursday.
| Per contract | Condor | Butterfly |
|---|---|---|
| Wing width now (SPY ≈ $760) | $11–12 | $11–12 |
| Credit, backtest average (weeks traded) | $288 | $755 |
| Max loss, backtest average | $743 | $245 |
| Credit as % of max loss | 39% | about 300% |
| Backtest P&L per trade ÷ max loss | +8.6% | +29% |
| Live example | Sep 14: $201 credit, $899 at risk | Oct 19: $733 credit, $467 at risk |
Exposure today is small. Each strategy trades one contract: the condor in a $1.0M paper account, the butterfly in a $101k one. At most about $1,400 is at risk across the two in any week, under 0.1% of the condor account and about 0.5% of the butterfly account. Neither strategy has subscribers trading it yet.
Per week, not per year. The published backtest pages annualize these results to about 216% (condor) and 678% (butterfly). Both figures are the average weekly P&L × 52 ÷ the average max loss. They assume mid fills, a floor chosen on the same 33 weeks, and the same capital redeployed every week, so they are not a realistic expectation. A more honest framing: in a good regime the butterfly earned about 29% of its at-risk capital per trade, it traded in 45% of weeks, and one bad week cost about 1½ average wins.
How far to trust the backtest
1. The edge doesn't come from the filter
This is the good news. Unlike the daily butterfly, both weekly structures make money with no floor at all: the condor +$969 and the butterfly +$1,073 over all 33 weeks. The floors keep about the same total on half as many trades. That raises the profit per trade and lowers costs, but it isn't where the money comes from.
| Condor floor | Weeks / P&L | Butterfly floor | Weeks / P&L |
|---|---|---|---|
| None | 33 / +$969 | None | 33 / +$1,073 |
| $100 | 31 / +$990 | $600 | 31 / +$1,079 |
| $150 (now in use) | 22 / +$662 | $650 | 22 / +$643 |
| $200 (strategy code) | 16 / +$1,019 | $700 (live) | 15 / +$1,053 |
| $250 | 9 / +$1,157 | $750 | 6 / +$470 |
| $300 | 5 / +$290 | $800 | 4 / +$521 |
Gross backtest P&L per contract at mid, January 5 – September 8, 2026, by minimum Monday credit.
The sweep moves the same way for both structures: a dip at the middle floor (condor $150, butterfly $650) and a local peak at the floor that was chosen. With 33 data points, that's noise around a flat line. The floor should be chosen for risk control, not to maximize backtest P&L.
2. Costs matter much less here
About $5 per round trip is 7–8% of the average trade, compared with 40% for the daily butterfly. Even at $24 per round trip, the pessimistic rate from our daily out-of-sample study, the floored strategies keep about +$635 (condor) and +$693 (butterfly).
3. The sample is 33 weeks, and the losses cluster
The two worst weeks for both structures were back to back, April 6 and April 13, during a sharp two-week sell-off. Outside April, the only losing week either strategy traded was February 2 (condor −$215, butterfly −$173). The result depends heavily on whether a year brings two Aprils or none. One 3% weekly move costs the condor close to its full $750–1,100 maximum loss, and there was no such week in the data.
4. A dollar floor turns off as volatility falls
Credits are priced in dollars, but SPY rose and implied volatility fell. Monday condor credits averaged about $265 in the first quarter and about $155 from May onward. At $200 the condor traded 13 times through April and 3 times since, which is why it hasn't traded live since September 21. The floor really encodes “only trade when volatility is elevated.” That may be a sensible rule, but then it should be written as one (credit ÷ wing width, or VIX), so it doesn't drift with SPY's price level.
5. Regime
Unfiltered, the butterfly made +$1,333 from January to April and lost $260 from May to September. The condor made +$795 and +$174. The floors happened to skip most of the May–September losers, but they also skipped the winners. The live record so far (butterfly +$645 on 3 trades) comes from the calmer late-September and October tape.
Operational issues
- The Thursday exit uses the order that failed for the daily condor. The weekly strategies close at 15:40 Thursday, with one day left on the options, using a 4-leg market order. The same order was rejected on all three Thursdays the daily condor traded, because its far wings had no quote. The weekly condor's wings are about as far out, so the 15:45 retry would fail the same way, and the position would depend on the 15:50 backstop or carry into Friday's expiry.
- The 15:50 backstop closes the whole account. It closes every position in the account, not just this strategy's four legs. The condor's account now also holds another strategy's stock trades, which would be sold if still open at 15:50 on a Thursday. It also wouldn't be safe once subscribers trade the strategy.
- The live condor floor differs from the published one. The live schedule passes a $150 floor; the strategy code and the published backtest page both say $200. And $150 tests worse than either no floor or $200.
- Dollar floors drift with SPY and volatility. See point 4 above. The condor has skipped the last four Mondays.
- No stop, and three nights of gap risk. Positions hold from Monday to Thursday with no exit before Thursday afternoon. The real worst case is the full wing, about $900–1,100 for the condor; the backtest's worst week was −$707.
- Thin data. Thirty-three weeks, one regime change and no crash. The 80%+ win rates and Sharpe ratios are not stable estimates.
What we plan to change
- The Thursday exit. Shared with the daily condor: we plan to send the close as a limit order at the combo mid that steps toward the bid, let long legs bid at $0.00–$0.05 expire rather than sell them, and keep a leg-specific retry.
- The backstop. We plan to replace the account-wide 15:50 close with one that closes only this strategy's four legs.
- The condor floor. We plan to set the floor in the strategy code rather than the schedule: either back to $200, or for both strategies a floor relative to the wing (for example, condor credit at least 20% of wing width, butterfly at least 60%), backtested over the 33 weeks first.
- A longer backtest. Thirty-three weeks of 2026 aren't enough for a strategy whose risk is a single bad week. Before adding subscribers or size, we plan to extend it to at least 2022 (a bear market) and early 2025 (a sharp sell-off).
- A stop for the condor. We plan to test one, for example closing when the loss reaches twice the credit. Its payoff ratio (+$190 / −$482) is where it's most exposed.
- The butterfly keeps running at one contract. It is the most promising of the four SPY condor and butterfly strategies we reviewed. We will re-check it after about 15 more trades, roughly eight months at the backtest's 45% pass rate.
Sources and methodology
- Scope. The Weekly Iron Condor and Weekly Iron Butterfly strategies as they trade today. The daily versions are covered in a separate note.
- Backtest. Our nightly backtest builder, re-run against the live scripts on weekly option legs, premium estimates and minute-level market values: 33 Monday entries from January 5 to September 8, 2026, at mid prices with a Thursday 15:40 exit. Our totals match the builder's last output (+$1,019 on 16 trades and +$1,053 on 15). The floor sweep, unfiltered and monthly splits, and cost sensitivity are additions for this note. An earlier filter study used a profit-target exit that the live strategies don't have, so its numbers aren't comparable.
- Live. Alpaca paper-trading fills on our 1-contract accounts since August 31. An August 31 same-day test trade that predates the butterfly strategy is excluded. The September 21 trades are shown but excluded from rule-based totals. Skip reasons and best credits come from the strategies' entry logs.
- Costs. About $5 per contract round trip, from the daily strategies' fills against logged mid prices. The weekly strategies use the same order code.
Results are from paper-trading accounts and backtests and do not reflect real money. Paper and backtest results may differ materially from live trading. Past performance does not guarantee future results. This note is research and education, not investment advice or a recommendation to trade any strategy or security. Options involve substantial risk and are not suitable for all investors.